

Venture Capital Breakdown for June
A total of $8.99 billion was invested in June, a decrease from the previous month of $11.54 billion. The five largest deals represented $800 million of invested capital. Total number of deals increased from 757 in May to 872 in June. Median pre and post valuations continue to rise.
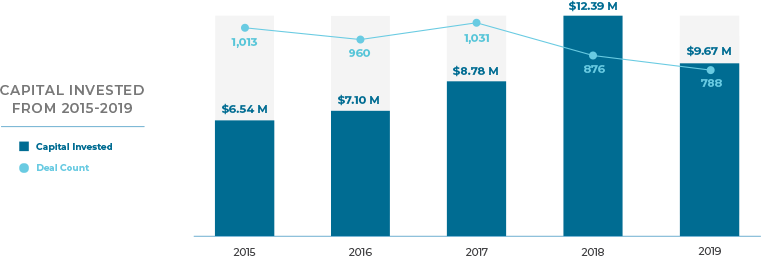
Series A deal count was decreased year over year for the year to date period ending June 2019. The total capital invested was $9.7 billion versus $12.4 billion for the same period the prior year. The total deal count was 788 in the year to date period for 2019 versus 876 in 2018. That is the equivalent to $14.1 million per Series A in 2018 versus $12.3 million per Series A in 2019.
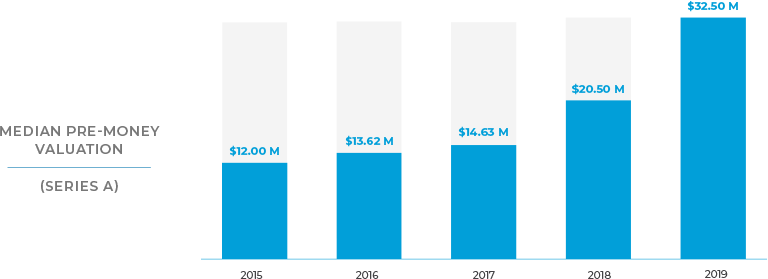
The media Series A pre-money valuation continues to trend of increasing over the last five years. This is largely function of larger single rounds skewing the data in the last two years.
Let’s talk
Schedule an intro call to learn about why MeldVal is important for your business. Or have any questions? We’re here to help.
Contact us